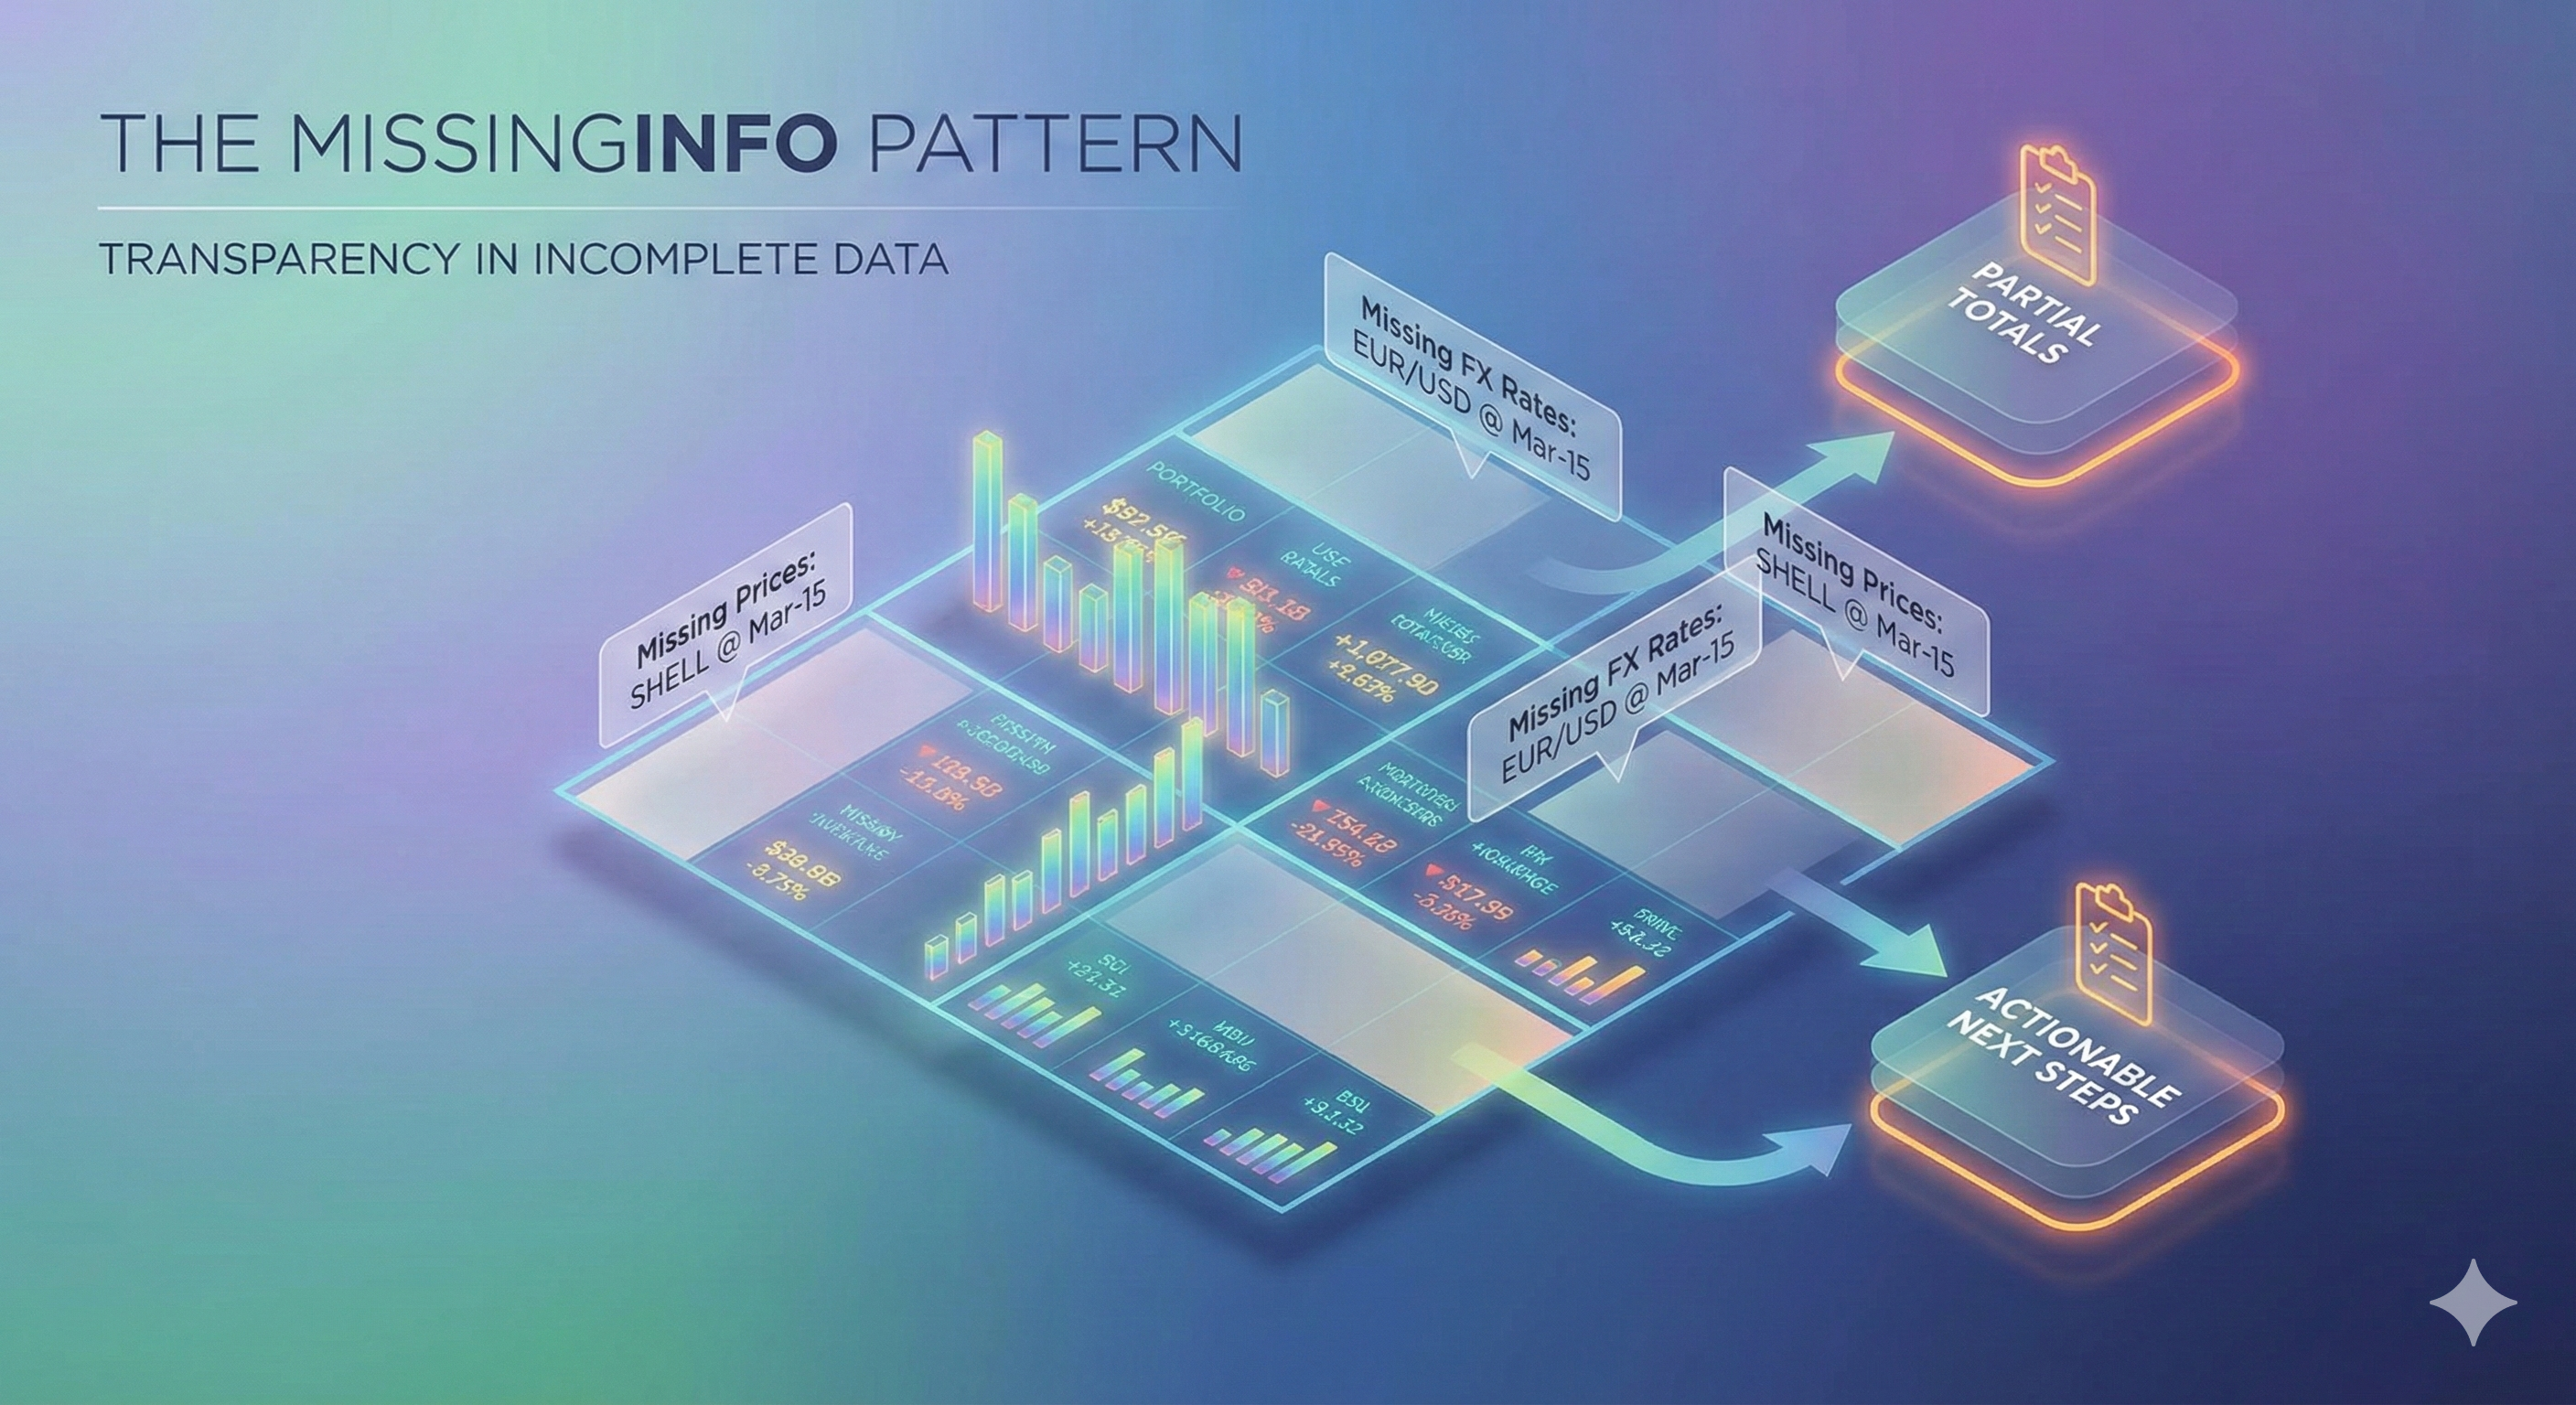
The MissingInfo Pattern: How Modern Portfolio Systems Handle Incomplete Market Data
The Challenge: Incomplete Market Data in Portfolio Valuation
Your portfolio has 50 positions. 47 have prices. 3 don't.
What should your system show for total market value?
In real-world portfolio management, incomplete data is a daily reality. Market feeds have gaps, exotic instruments lack pricing, and FX rates for emerging currencies may not be available immediately.
The question becomes: how do you provide useful information to users while being transparent about what's incomplete?
| Approach | System Behavior | User Experience |
|---|---|---|
| Block calculation | Report fails entirely | No visibility until data is complete |
| Exclude missing items | Calculate with available data only | Partial result, but gaps not visible |
| Track what's missing | Partial result + explicit gap list | Transparency and actionable next steps |
The Pattern: Results That Know What They Don't Know
The MissingInfo pattern wraps calculation results with context about what data was available and what was missing. Each result carries:
- The computed value (when calculable with available data)
- A list of missing instrument prices that would complete the calculation
- A list of missing FX rates needed for currency conversions
This allows the system to provide partial results while making gaps explicit:
Standard Result
Value: 2,450,000

(Complete positions only)
MissingInfo Result
Value: 2,450,000
Missing Prices: SHELL @ 2024-03-15
Missing FX Rates: EUR/USD @ 2024-03-15

(Shows what's needed)
Two Categories of Missing Data
Missing Instrument Prices
- Cause: Illiquid securities, delayed feeds, newly added instruments, exotic derivatives
- What's captured: Date, Instrument identifier, Contract parameters (for derivatives)
Missing FX Rates
- Cause: Exotic currency pairs, weekend/holiday gaps, emerging market currencies
- What's captured: Date, Base currency, Counter currency
By separating these categories, operations teams can route issues to the right people - pricing teams for instruments, treasury for FX rates.
How Missing Information Propagates Through Calculations
The pattern's power comes from automatic propagation. When you combine two values, their missing data combines too.
Value: $500,000
Missing: None"] P2["POSITION 2: Shell
Value: Unknown
Missing: SHELL price @ Mar-15"] P3["POSITION 3: Nestle
Value: CHF 200,000
Missing: CHF/USD rate @ Mar-15"] PT["PORTFOLIO TOTAL
Partial Value: $500,000 + ???
Missing Price: SHELL @ Mar-15
Missing FX: CHF/USD @ Mar-15"] P1 --> PT P2 --> PT P3 --> PT style P1 fill:#d4edda,stroke:#28a745 style P2 fill:#fff3cd,stroke:#ffc107 style P3 fill:#fff3cd,stroke:#ffc107 style PT fill:#f8d7da,stroke:#dc3545
Key behaviors:
- Missing information from any component bubbles up to the aggregate
- Duplicates are automatically removed (same missing price only listed once)
- Missing items are sorted by date for easy prioritization
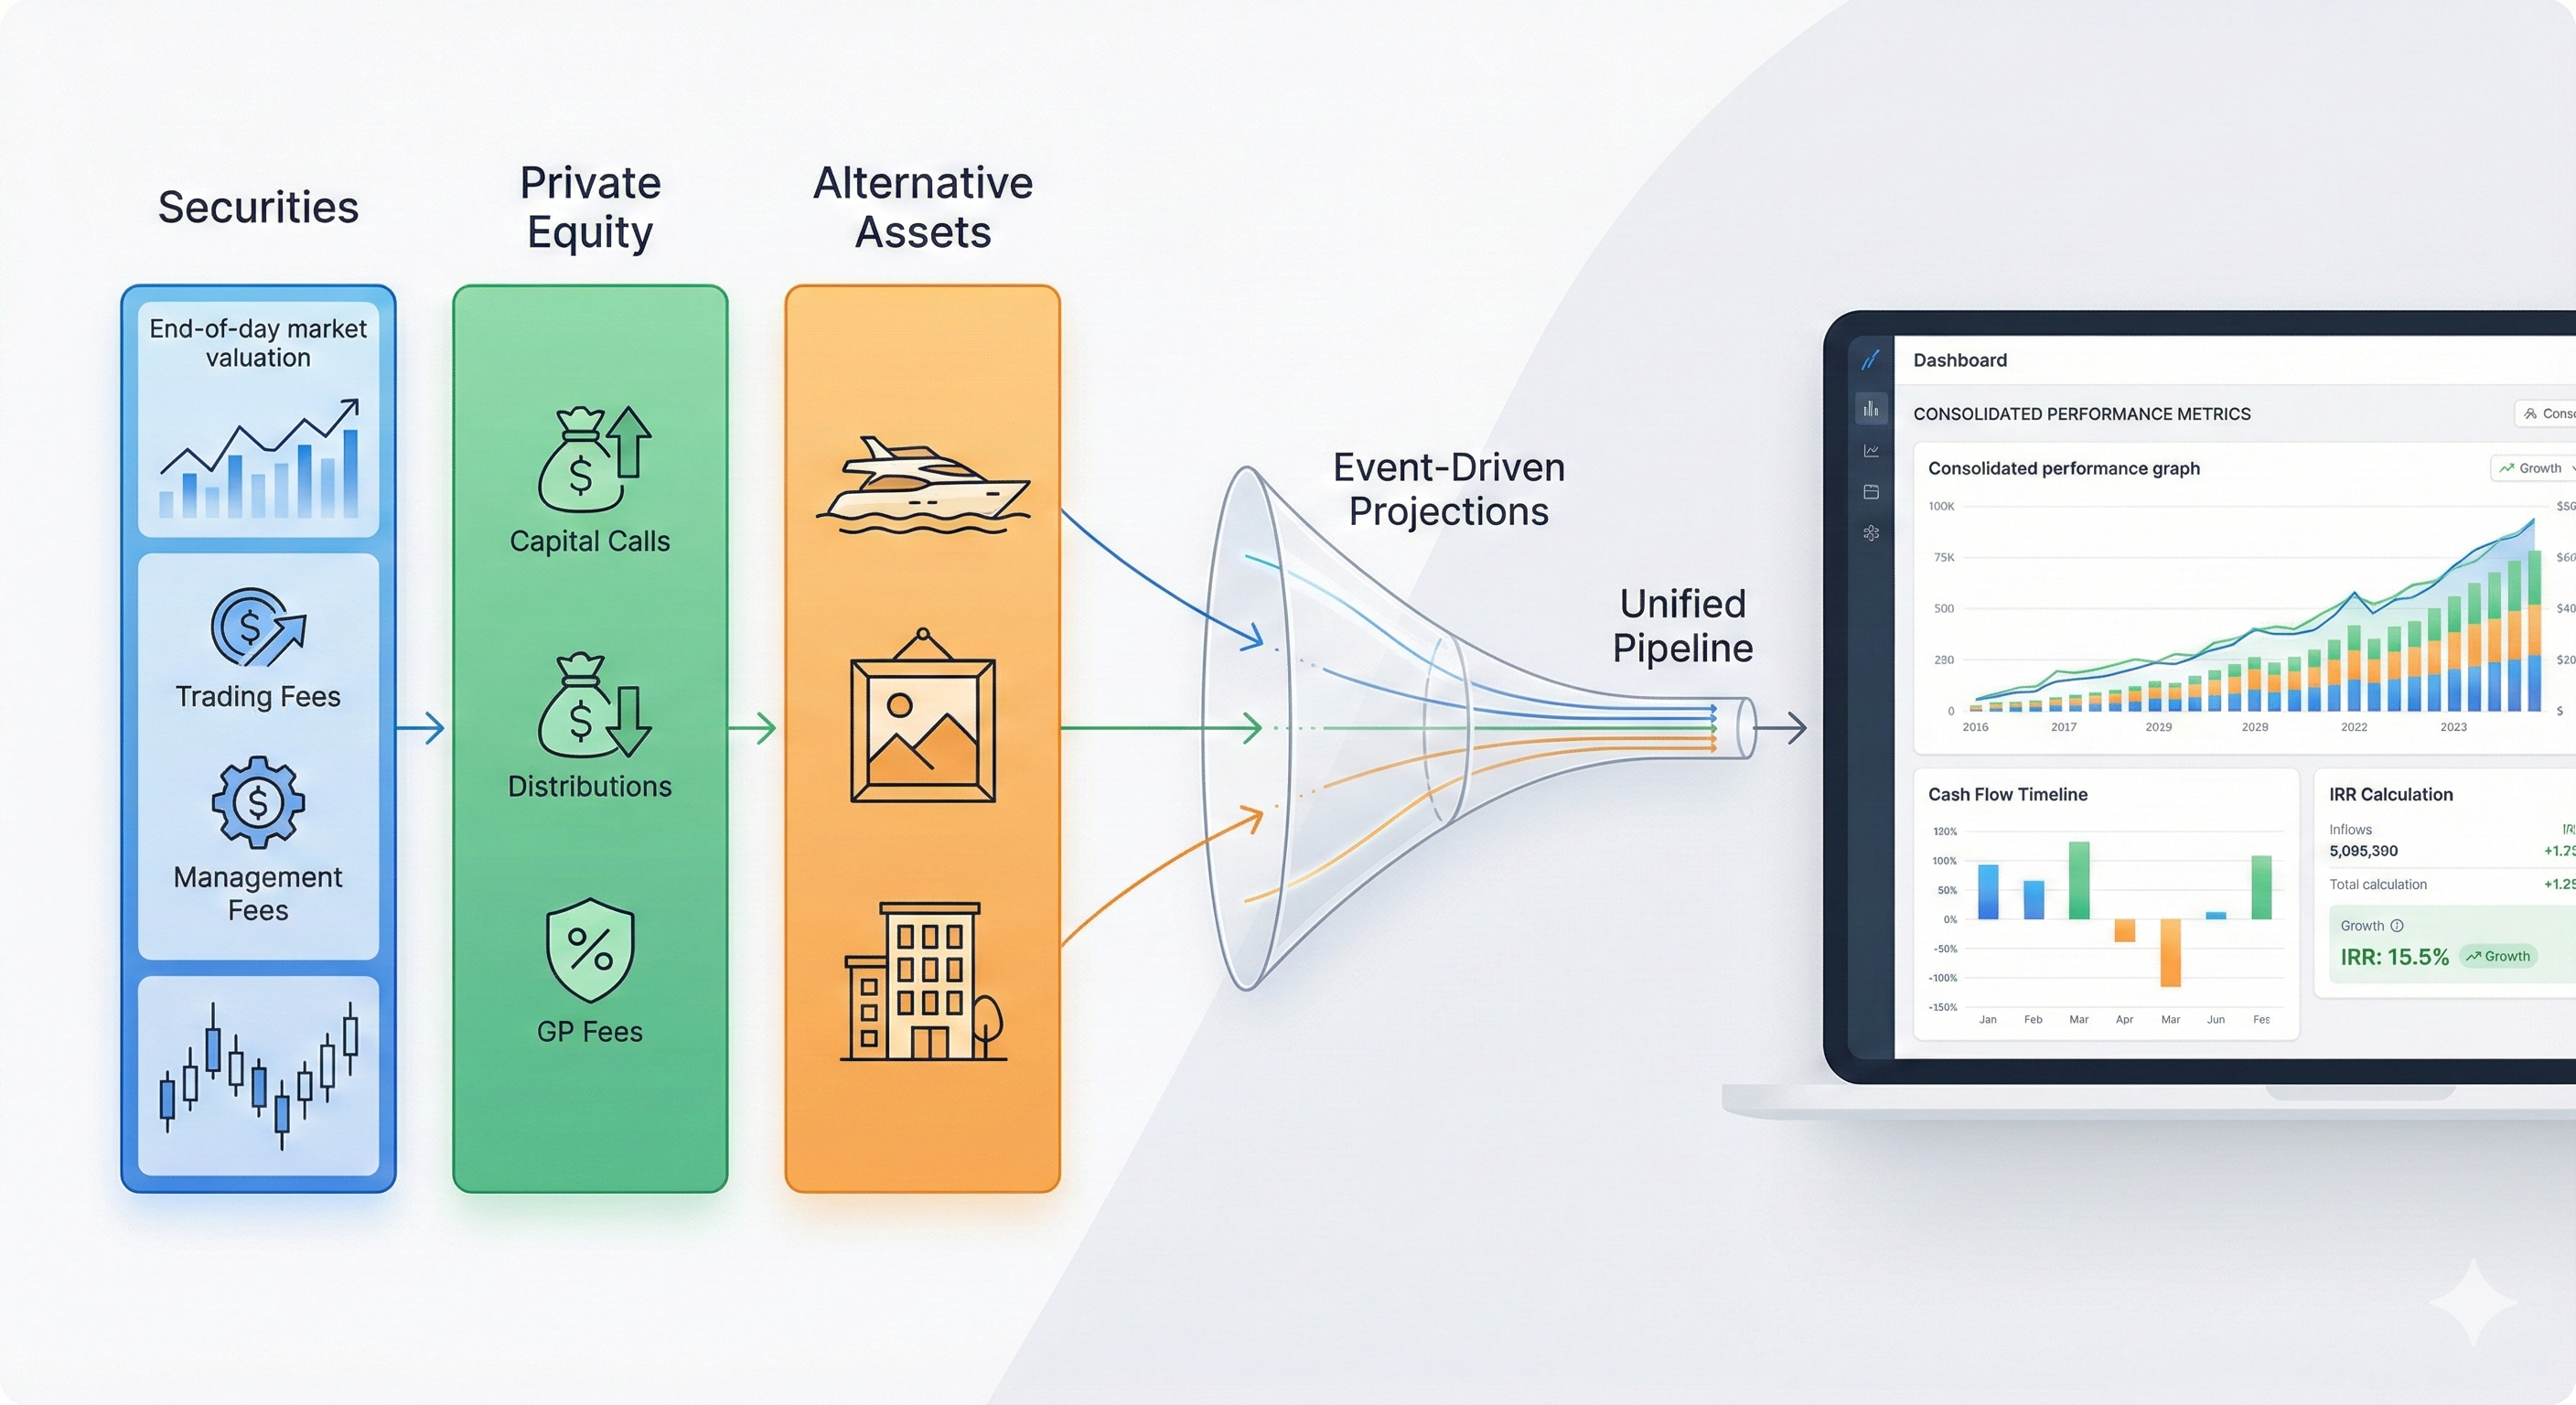
The Valuation Chain: Where Missing Data Originates
Here's how data flows through a typical valuation:
• Market Value in Asset Currency
• Market Value in Reporting Currency
• Accrued Interest
• Unrealized Gains"] AGG["AGGREGATION LAYER
• Position Totals
• Portfolio Totals
• Client Totals"] EXT --> PF EXT --> FXF PF --> PL FXF --> FXL PL --> PR FXL --> FXR PR --> CALC FXR --> CALC CALC --> AGG style EXT fill:#e7f3ff,stroke:#0066cc style CALC fill:#fff3e0,stroke:#ff9800 style AGG fill:#f3e5f5,stroke:#9c27b0
At each calculation step:
- If data is available → wrap the value
- If data is missing → wrap the "missing" information instead
- When combining → merge both values AND missing information
The User Experience: Contextual Exposure of Data Gaps
By including missing information as part of the calculation result, the UI can contextually expose data gaps exactly where they matter. The workflow becomes:
Generate report
See partial total
with warning"] S2["STEP 2
Click warning
View missing data:
• SHELL @ Mar-15
• PE Fund III @ Mar-15
• EUR/USD @ Mar-15"] S3["STEP 3
Enter missing
values directly
Data saved"] S4["STEP 4
Refresh report
Complete
valuation"] S1 --> S2 S2 --> S3 S3 --> S4 style S1 fill:#fff3cd,stroke:#ffc107 style S2 fill:#cfe2ff,stroke:#0d6efd style S3 fill:#d1e7dd,stroke:#198754 style S4 fill:#d4edda,stroke:#28a745
The missing information travels with the calculation result, allowing the UI to show users exactly what's needed in context - not as an error, but as actionable next steps.
Deduplication: Clean, Actionable Lists
When a portfolio has 100 positions in Shell stock across 20 accounts, the missing price appears once, not 100 times.
from 100 positions"] D1["SHELL @ Mar-15"] D2["SHELL @ Mar-15"] D3["SHELL @ Mar-15"] D4["... 97 more"] DEDUP["DEDUPLICATION
Unique by Date + Symbol"] RESULT["AFTER DEDUPLICATION
SHELL @ Mar-15"] RAW --> D1 RAW --> D2 RAW --> D3 RAW --> D4 D1 --> DEDUP D2 --> DEDUP D3 --> DEDUP D4 --> DEDUP DEDUP --> RESULT style RAW fill:#f8d7da,stroke:#dc3545 style DEDUP fill:#cfe2ff,stroke:#0d6efd style RESULT fill:#d4edda,stroke:#28a745
Deduplication rules:
- Prices: Unique by (Date, Instrument Symbol)
- FX Rates: Unique by (Date, Base Currency, Counter Currency)
This keeps the action list manageable, regardless of how many positions are affected.
Business Benefits
For Operations
- No more hunting through reports to find data gaps
- Missing data becomes a prioritized to-do list
- Inline entry reduces context switching
For Compliance
- Reports clearly indicate completeness
- Audit trail shows what was missing and when it was fixed
- No silent substitution of zeros that could mask issues
For Portfolio Managers
- Partial valuations still provide directional insight
- Clear visibility into data quality
- Faster turnaround on complete reports
For Technology
- Pattern is composable - works across any calculation
- Type-safe - compiler enforces proper handling
- Testable - missing scenarios are explicit, not edge cases
Requirements Checklist for Evaluating Systems
When evaluating portfolio management systems, consider these capabilities:
These features help systems handle the reality of incomplete data gracefully, providing transparency and enabling efficient operations workflows.
The Three Principles
Principle 1: Make Gaps Explicit
Include missing information as part of the result
Transparency enables informed decisions
Principle 2: Propagate Context
Missing information flows through calculations
Aggregates carry complete context from components
Principle 3: Enable Action
Contextual exposure of gaps in the UI
Users see what's needed, where it's needed
Conclusion
The MissingInfo pattern provides a structured approach to handling incomplete market data in portfolio systems.
By making missing information an explicit part of calculation results, systems can provide transparency while maintaining operational efficiency. The UI can contextually expose data gaps to users, turning incomplete data into clear, actionable next steps.
In wealth management, where data completeness directly impacts reporting accuracy and operational workflows, this pattern offers a practical solution to a common challenge.
What approaches have you seen for handling incomplete market data? We'd love to hear from others in the wealth management space.